February
26
January
3
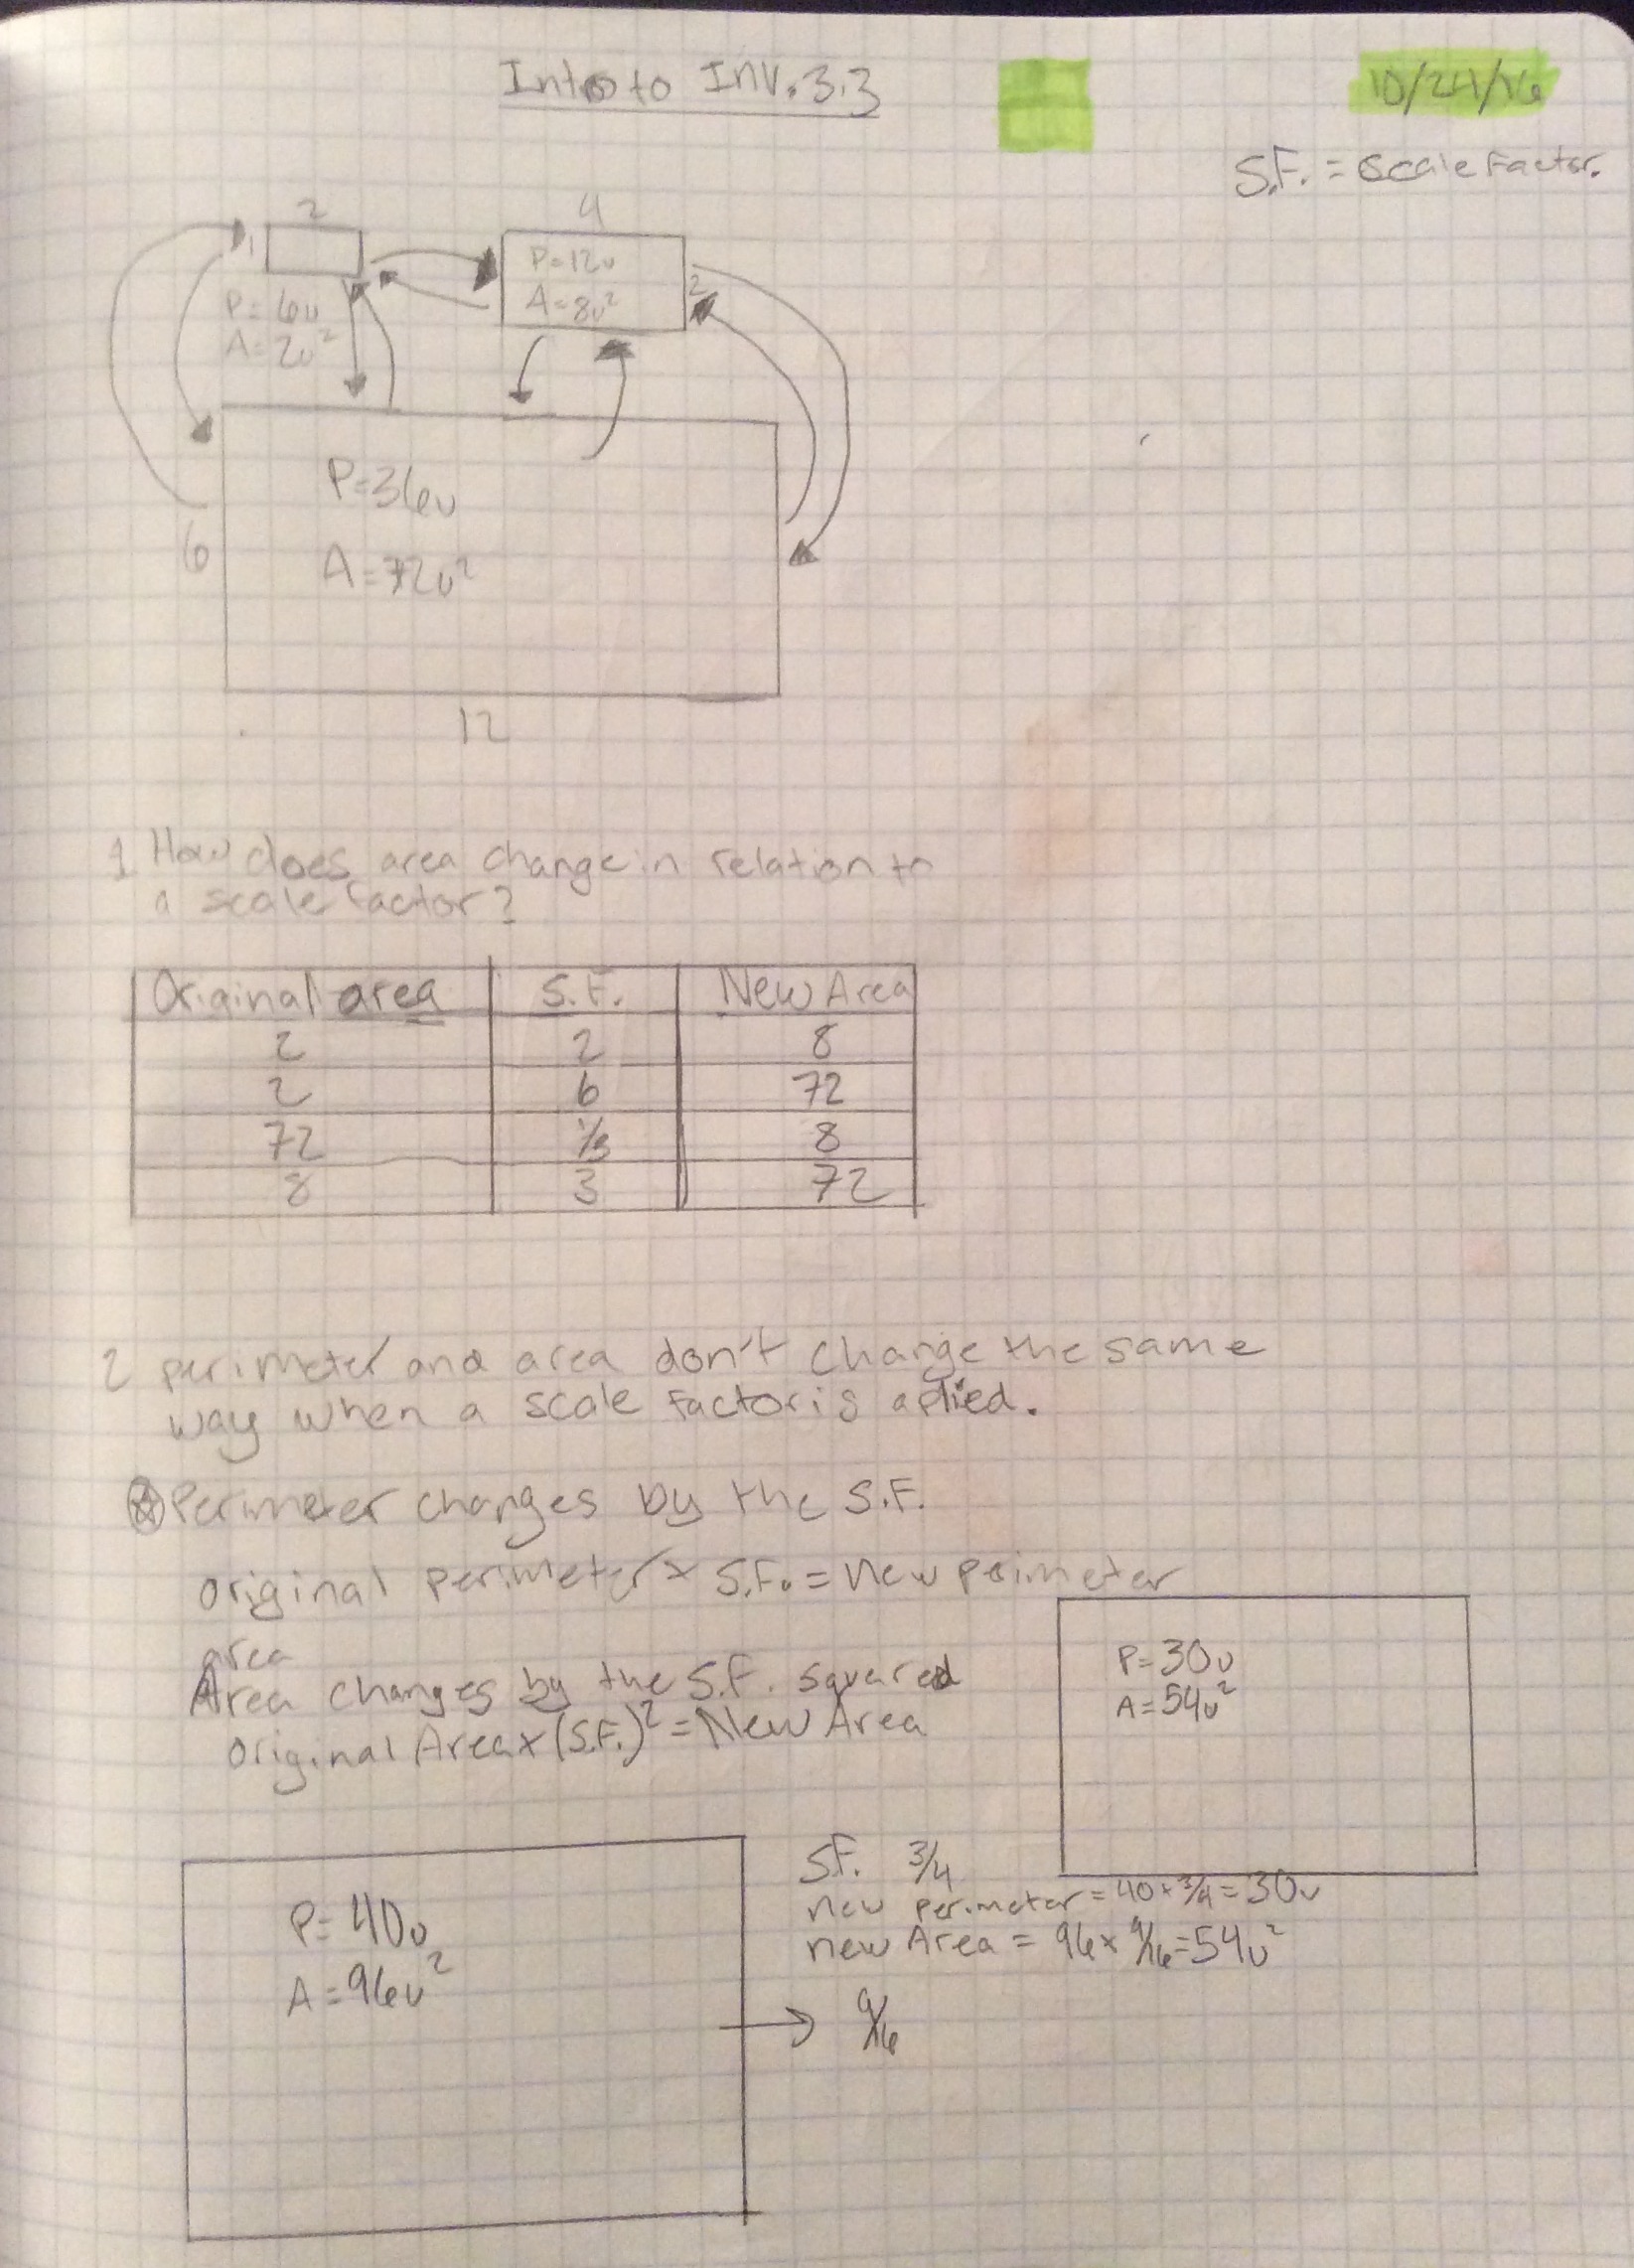
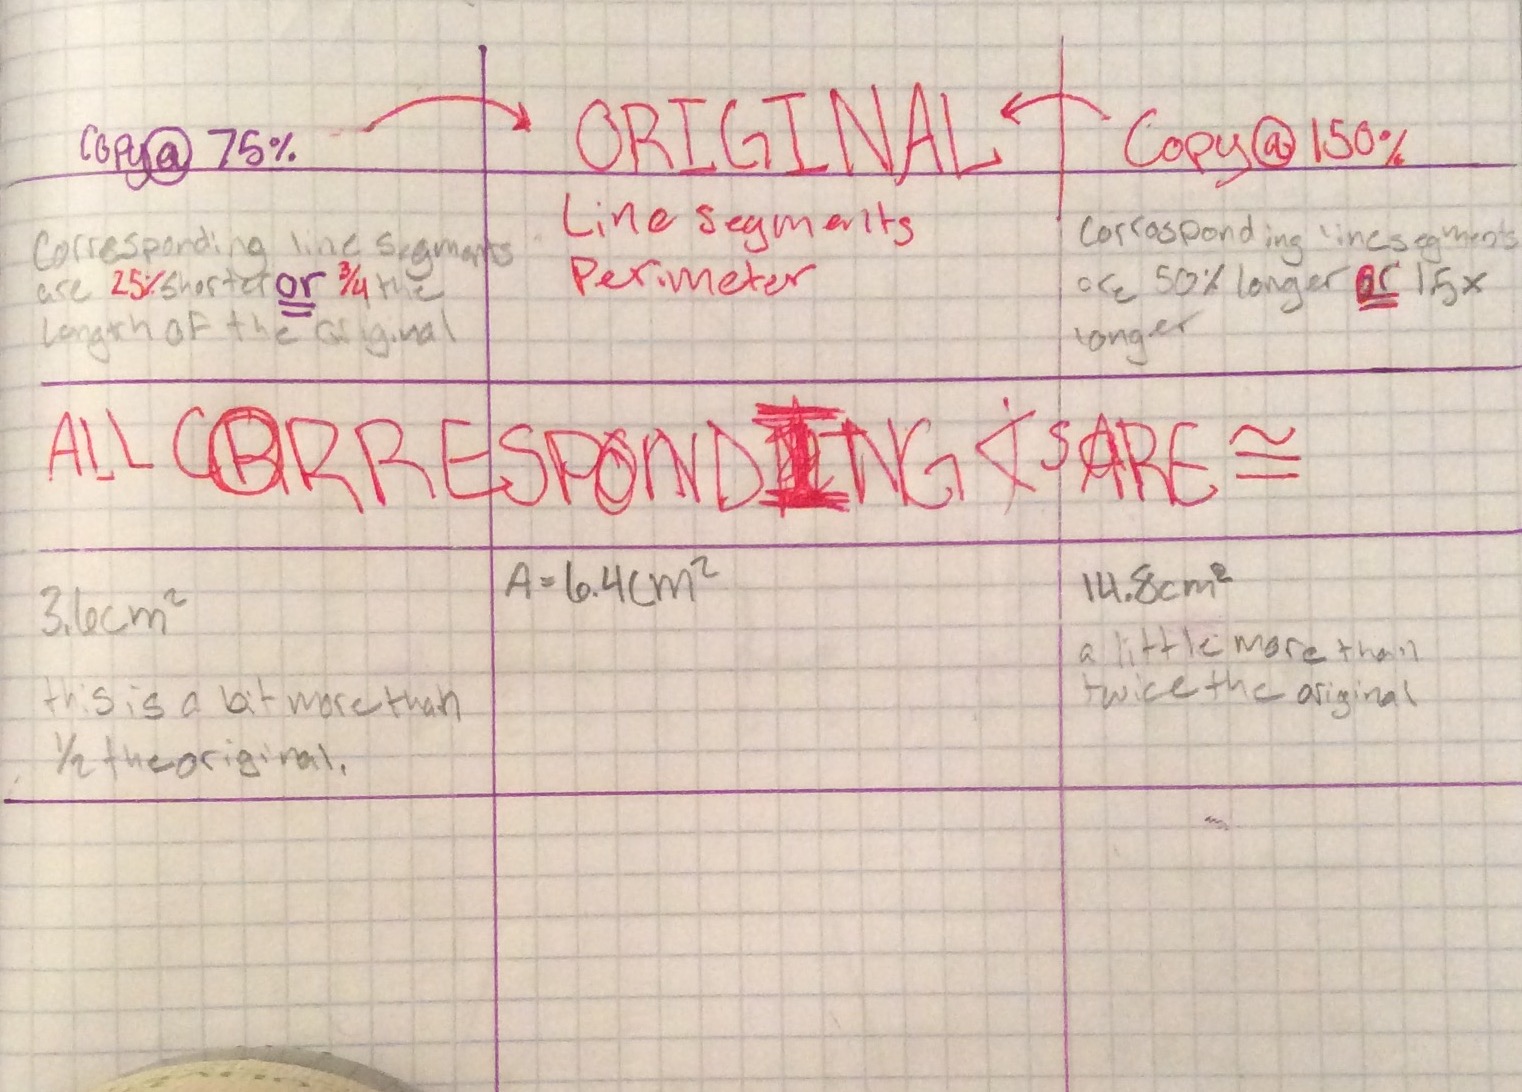
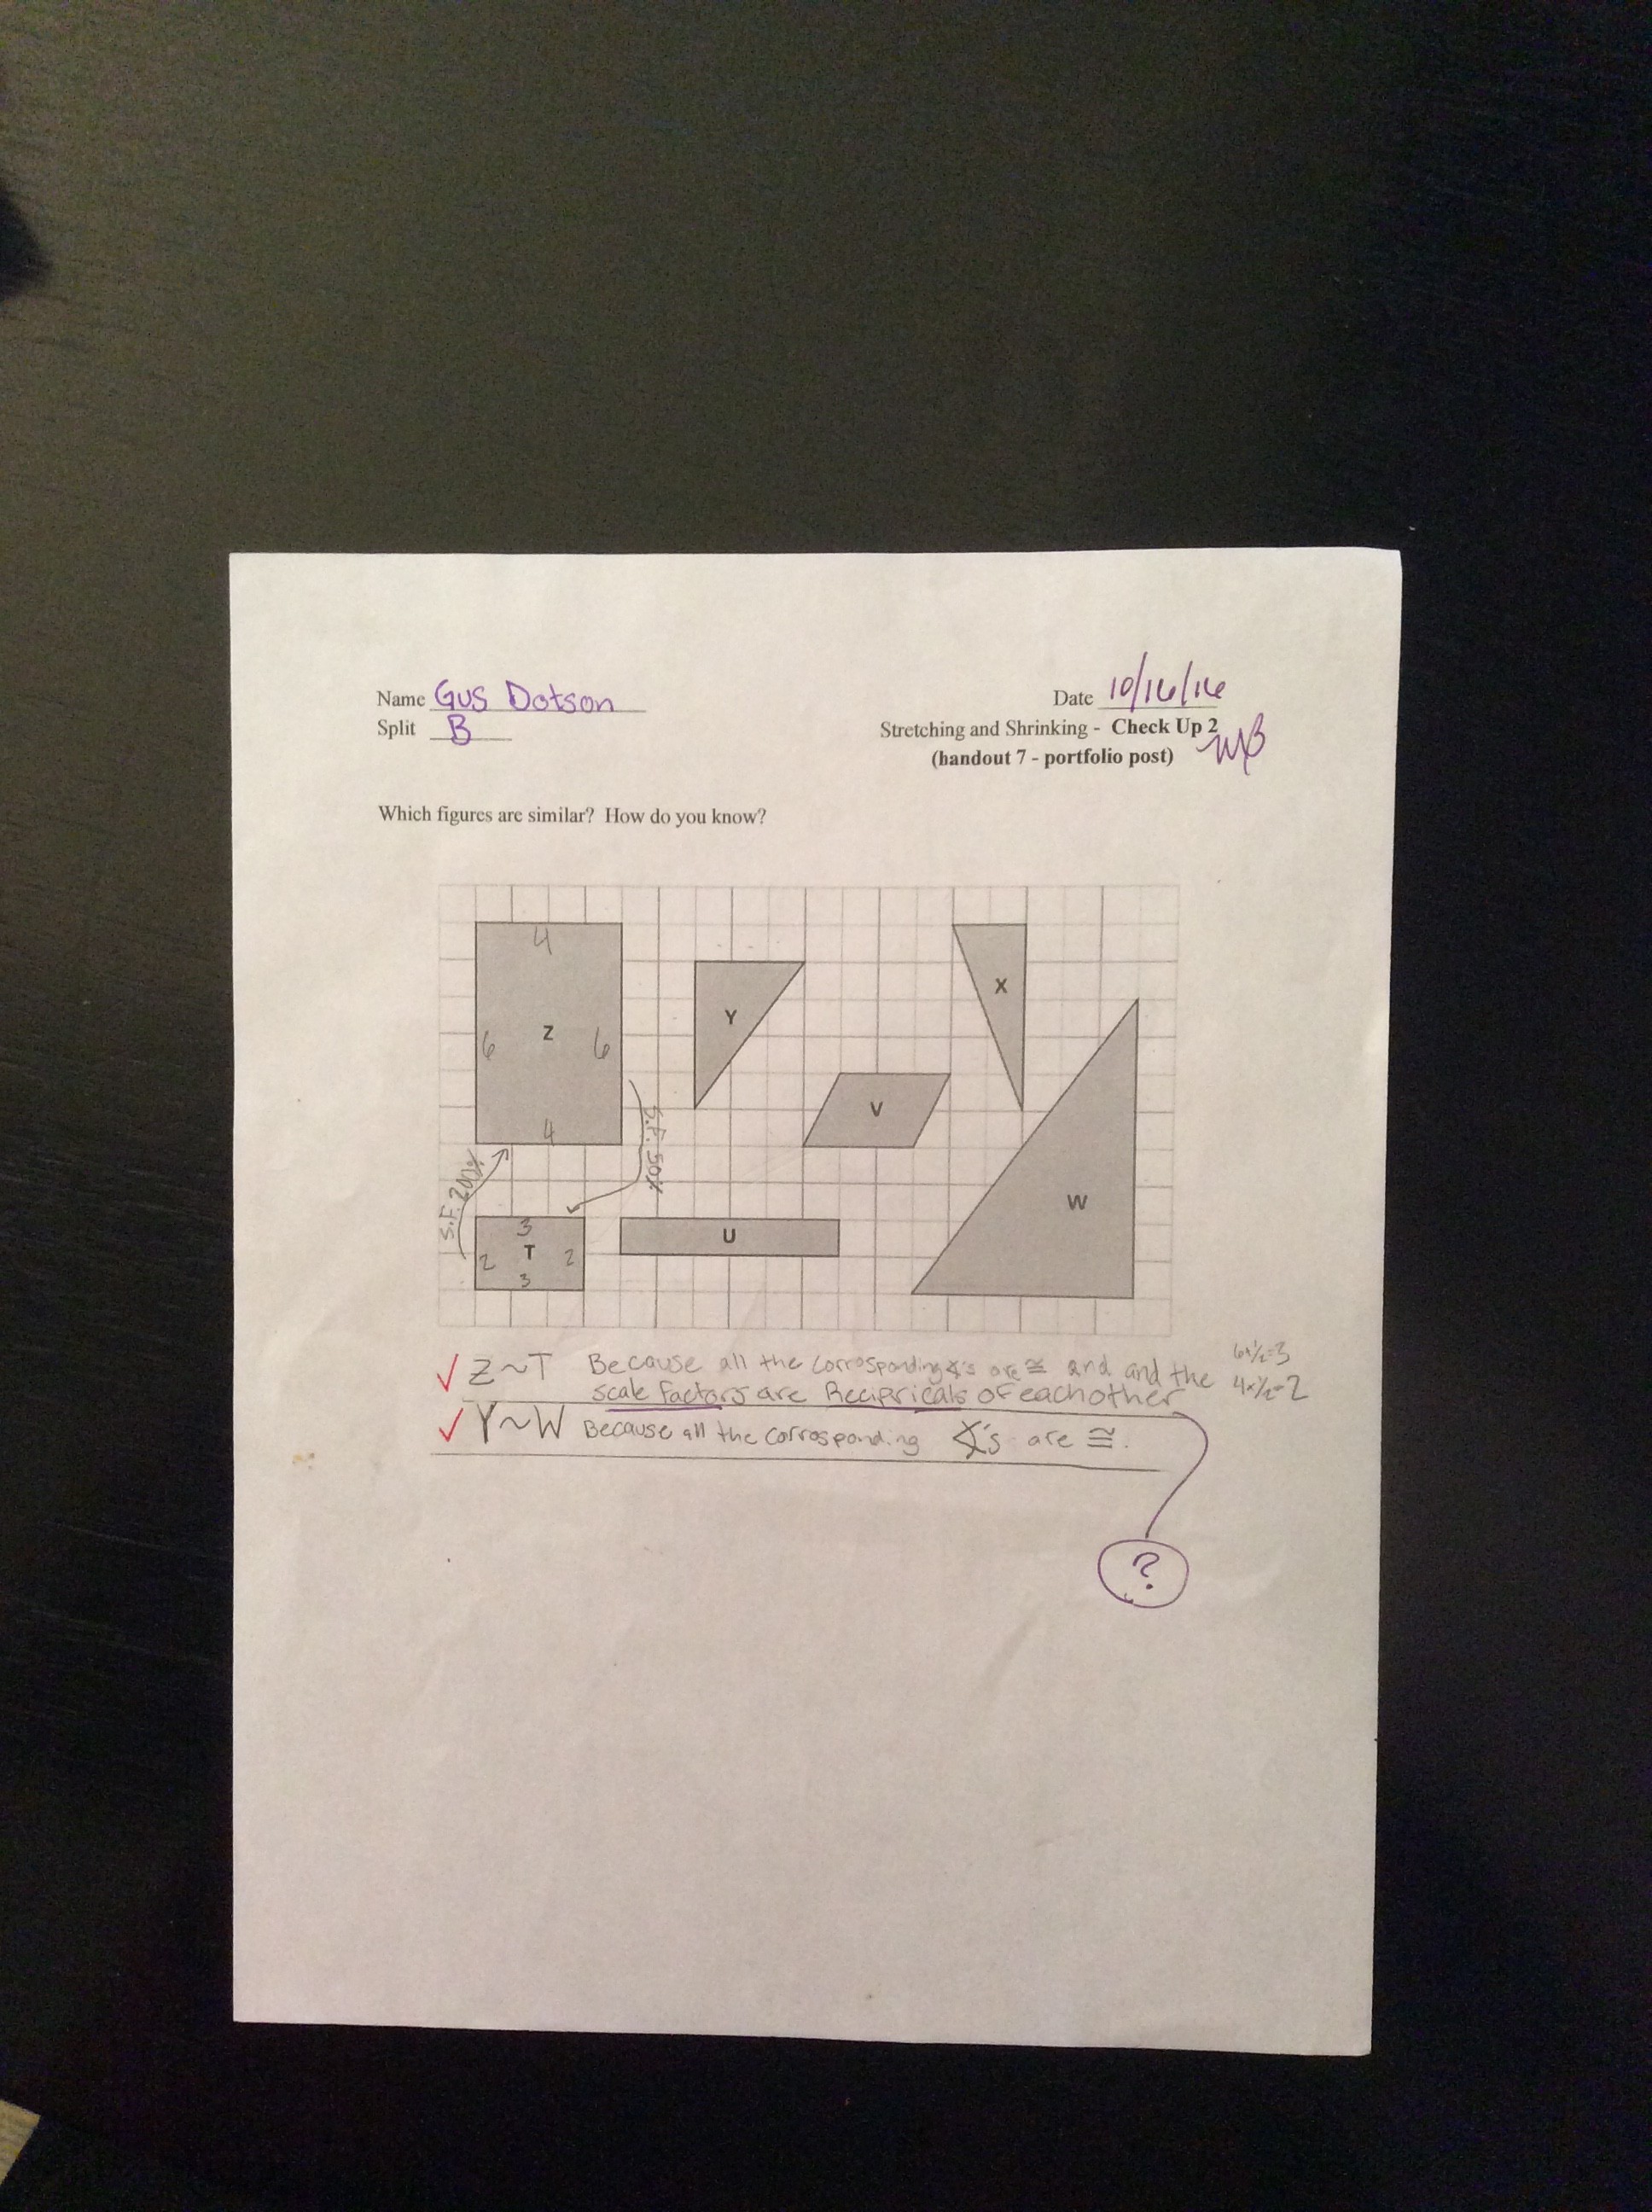
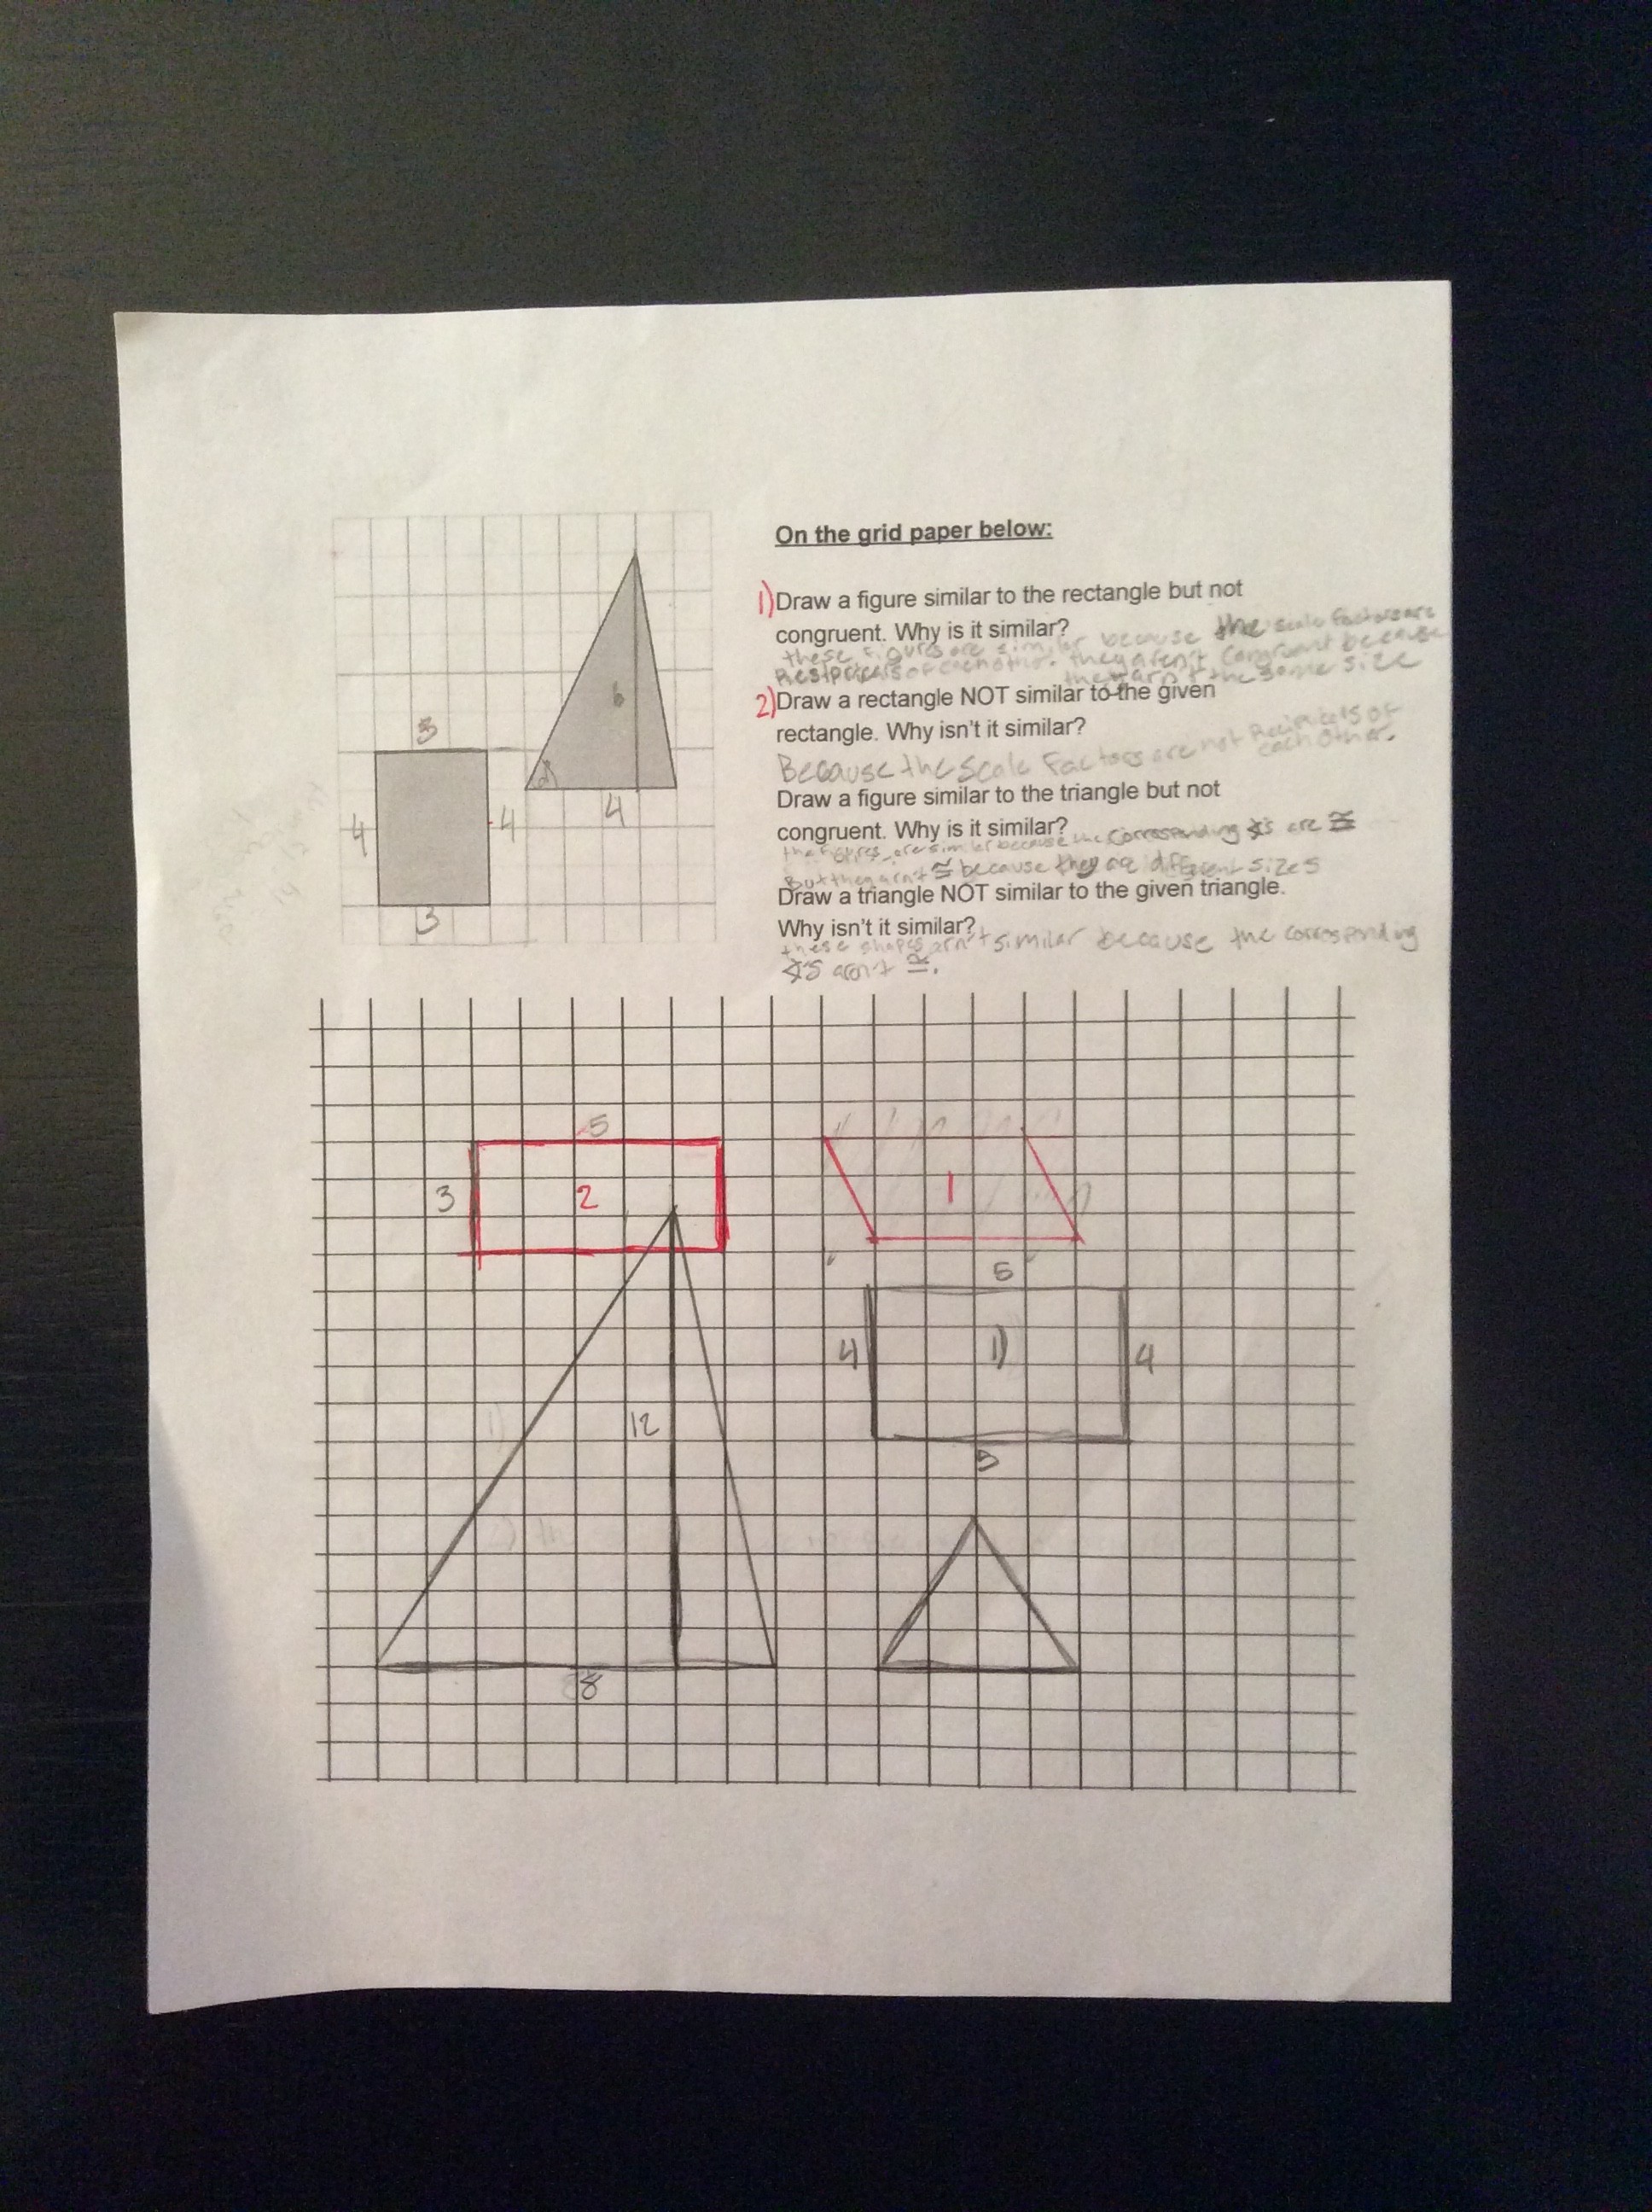
Stretching and Shrinking Portfolio Post
Figures are mathematically similar when corresponding side lengths are related by a scale factor, and all corresponding angles are congruent. For triangles, it only matters if the corresponding angles are congruent. For rectangles, it only matters if the corresponding side lengths are related by a scale factor. All mathematically similar figures have the exact same shape. Some are bigger, and some are smaller.
Any two rectangles are similar: False.
A 3×5 rectangle is not similar to a 3×3 rectangle. Their side lengths are not related by a scale factor. You can do it by ratio too. If you set it up like a proportion, you have three over five and three over three. Three times five equals fifteen. Three times three equals nine. Fifteen and nine aren’t the same number.
Any two equilateral triangles are similar: True
All equilateral triangles have three sixty degree angles. Triangles are similar if their corresponding angles are congruent. If all angles are 60, then they’re automatically similar.
October
30
Math Post #2
Good Bad
I think that the good one is good because it is neat and has a few examples to show what I am explaining. I think that the bad one is bad because it is messy and not very clear what I am saying. Plus there are no examples. I have noticed that I have not had any very messy pages seance the beginning of the year.
October
30
Math post 1
This assignment was all about finding similar figures. To solve this sheet you mainly just had to find a scale factor and is two shapes had the same scale factor then they were similar. I didn’t find this to be a very difficult sheet but I think it would be much easier now that I understand scale factors better.
November
6
Math Post 2

November
6
Math Post 1

October
29
My Math Puzzle
October
16
Population of the world
The reason that my graph is the shape it is, is because I don’t think that there was very much change in the population of the world until the modern era. At first my graph was very different. Then Ana told us that there was a population of 5 million people 8,000 years ago. The original shape of my graph was very rigid but then I made it very flat withsudden steep climb. Made it that way because that was when people truly got intelligent but enough to make babies so the population grew. So here we are now with the population of almost 8,000,000,000 people.

October
8

Personally I think that the third one was the hardest to graph because it curve and goes from large jumps to smaller and smaller jumps. I would say that the 2nd one would have been the easiest because it has a very steady climb. Also it only stops once for six seconds. personally I think that the one I did was not the best because it was inaccurate.