Science Second Quarter
In science we have bin studying glucose. Glucose is tree food. Glucose is sugar. We had to present what glucose was made of. My group made a slide show with the formulas of glucose. I struggled with the formulas because there were a lot of formulas and they were complex to me.
Wire figures second Quarter Art
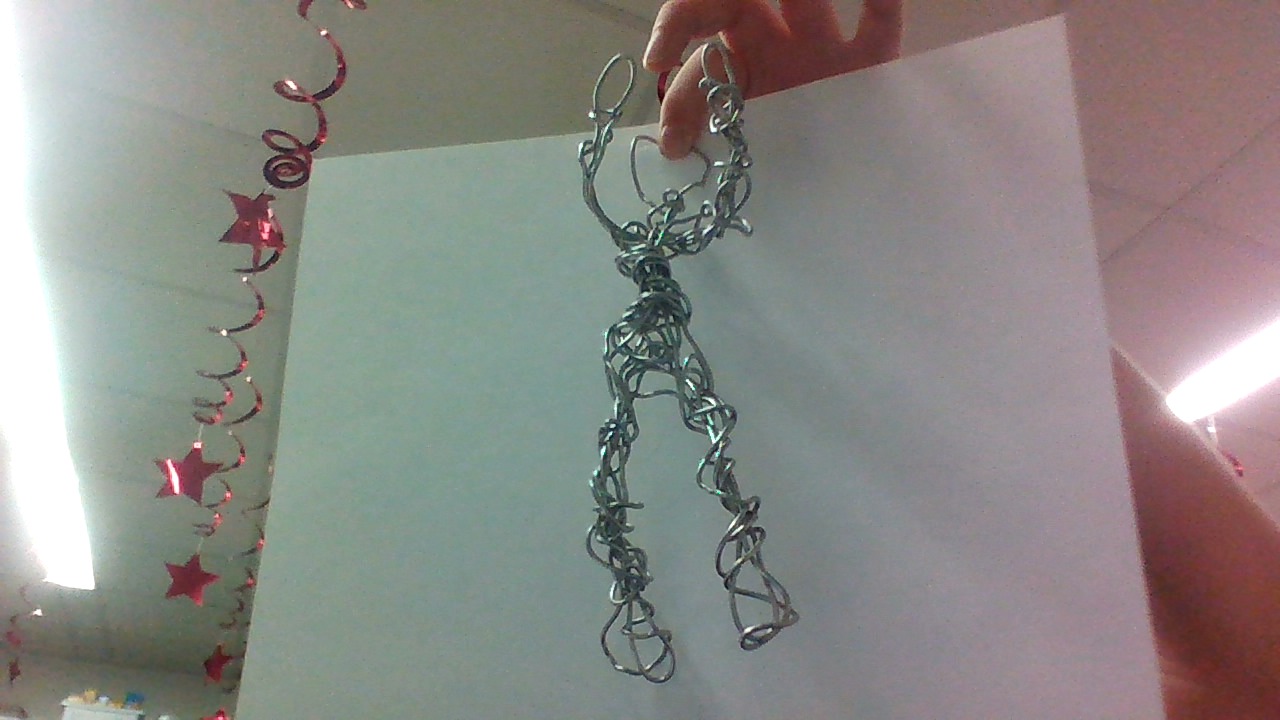
This my wire sculpture. At first my sculptures were terrible then Wyatt told me a trick of for making the sculptures me how to make one correctly. My sculptures is of me shooting a lay up. To get the right size we made proportion drawings. This is a proportion drawing. 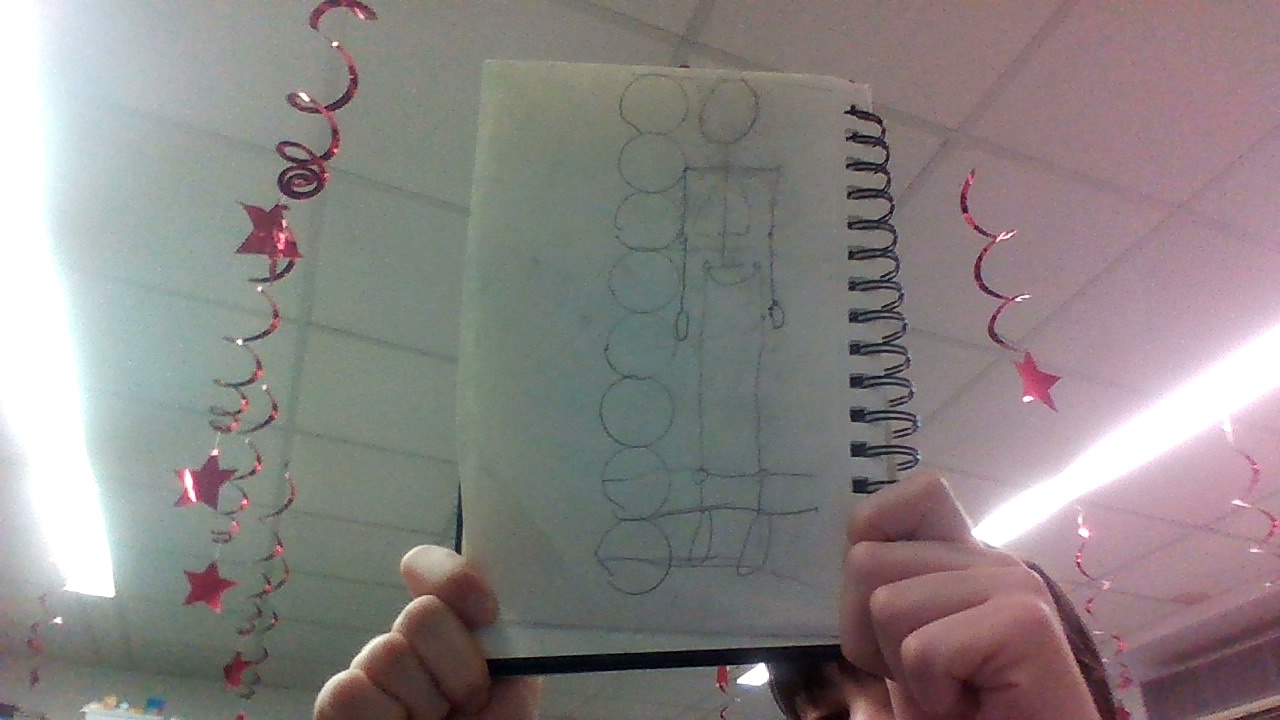
Emotional Cartography
 This is a picture of my emotional cartographic map. It may not look like a map but it is one because it is showing my emotions on my walk to school. Usually with emotional cartography you use colors to represent your feelings. In one of the small drawings I used blue to represent sadness. You can make a Emotional cartography map with about anything, including how a person looks at their surroundings.
Math First Quarter
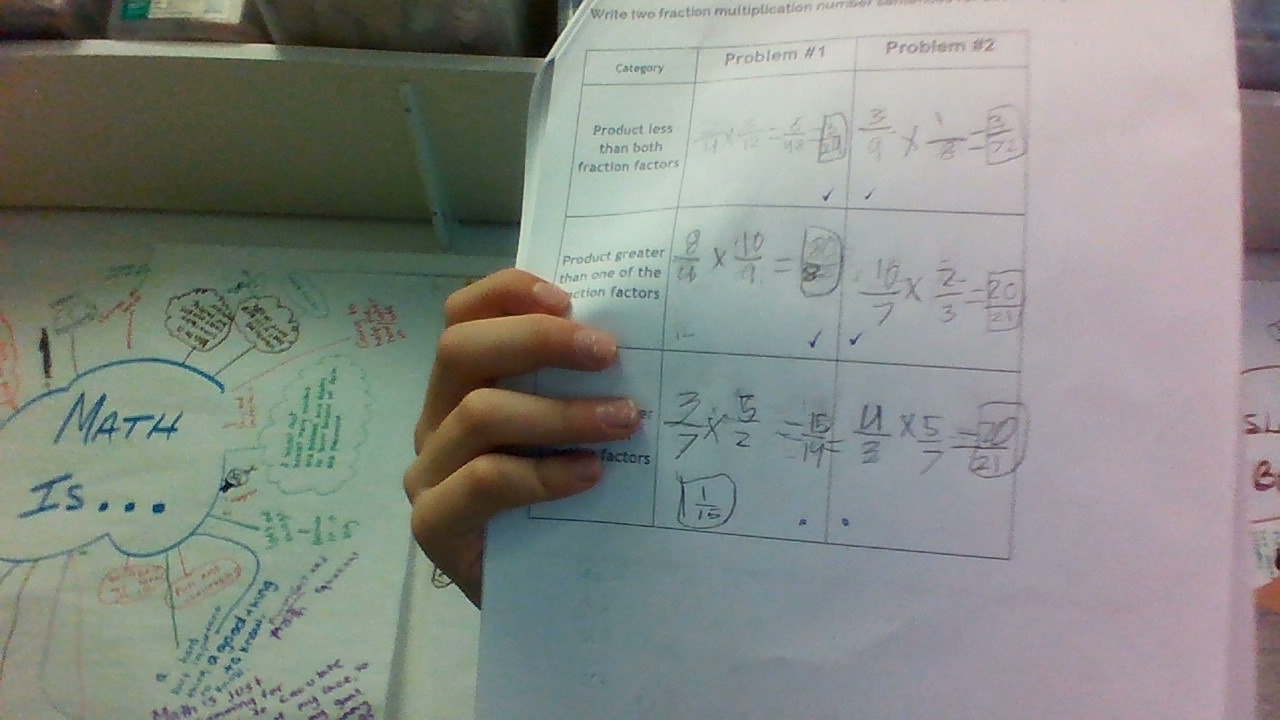

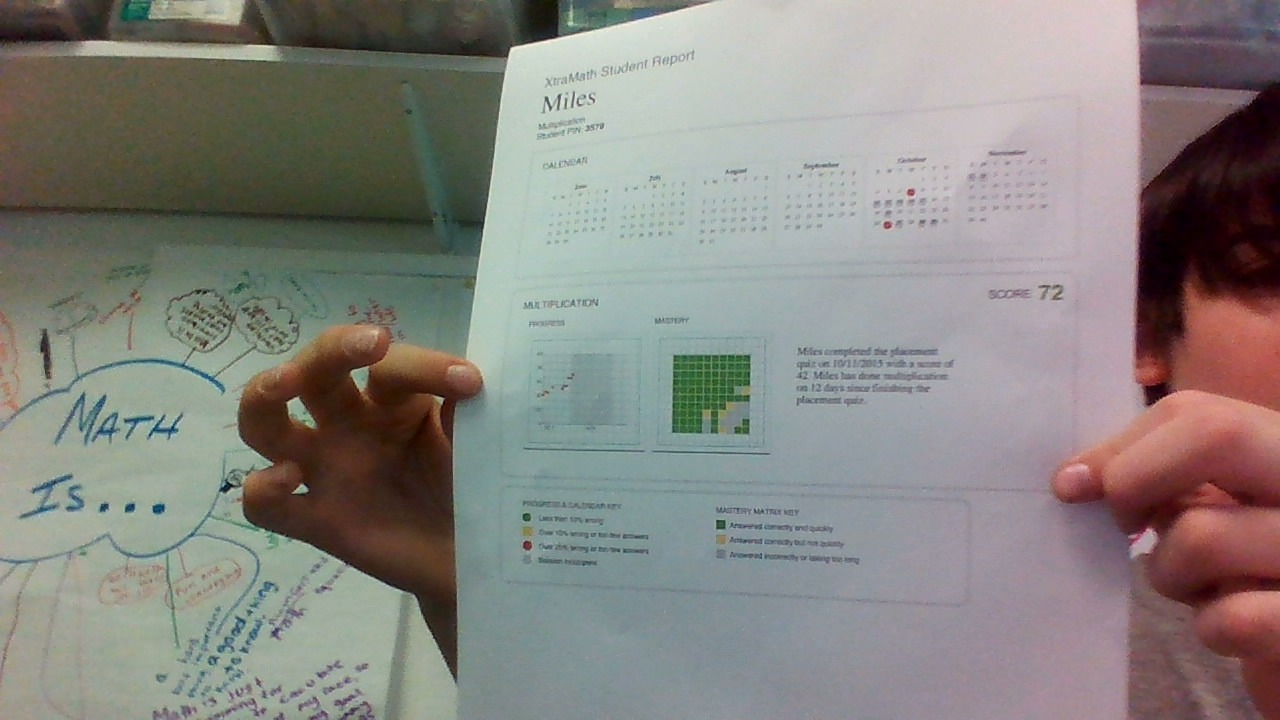 The picture in the top left is of a page in my math test. On that page I got four problems right and two wrong but on the test I only got two’s and one 2.5. The picture on the top right is a pop quiz were I got two right and I did not simplify one. The picture on the bottom is my scores from Extra Math.
Soundtrap Piece
In music we had to make a song in soundtrap. In our song we had to export parts from noteflight and put them on our piece. Another thing we have to do is add a part for a teacher to add in our piece. Another thing we had to do was have our piece in a chord.

12