Math Graphs
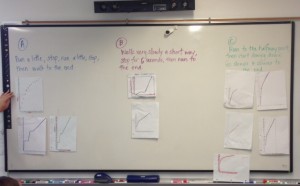
Today in math, we were making graphs based on three different problems. All of the problems were about different ways that people walked 20 meters. We got to choose which problem to a graph on. After we made our graphs, we mix and matched them and we were each given a graph that was not ours. Then, we had to put the graphs that we were given, up on the board, based on what problem we thought that graph was about. The way that we sorted out the graphs was that we saw the shape and the shape of the graph effected the meaning of the graph and what running story to put the graph in. If you look really closely at the picture, you can see that if two graphs are in the same category, they probably look pretty similar. When I looked at the board, I noticed a couple of things. I noticed that all of the problems that we were given to graph about were very similar, therefor, not a lot of the graphs were put in the wrong place. For some of the graphs, when people were putting them up on the board, a lot of people did not notice that the person stopped a little bit, so they placed them not knowing that the person stopped for a few seconds. I could say so much more, but then this post would take hours to read. I hope you all enjoyed this problem just as much as I did.
Margaret, this is a terrific summary of the activity and the problem. It would be great to hear you give a little detail about how graphs being a similar shape helped them be put in the right place. Give an example. How does the shape connect to the meaning of the graph?