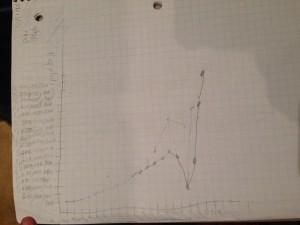
My graph is this shape because…
The curve in this graph is because the more people there are in the first place, the more the next generation will have. And then that generation will have even more kids.
The reason it drops so suddenly is because the Ice Age and wars started at about that time. The population would have dropped drastically.
In the present day, the population is about 8,000,000,000. When Ana gave us the information that in 8,000 B.C.E. there were 5 million people. I had to re-think my whole graph.

Remember that it took us until the 1800’s to reach our first billion. Does this change your graph?