https://app.letsrecap.com/public/r/cafa475c0f90c4579025d2e73bfcefe3

Above is the link to one of my Recap videos. Recap is an app in which teachers can send a video of themselves asking a question and the students have a certain amount of time to answer it. In this recap, we were asked to say if we found unit rates helpful (because we were wrapping up the unit on unit rates) and to come up with an example of comparing two items by using unit rates.

Mathematical Similarity Summary

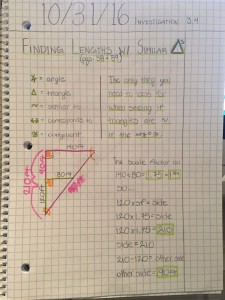
Figures are mathematically similar when the corresponding angles of the two figures are congruent. Two figures are also similar when they are related by a scale factor.

screen-shot-2016-12-16-at-1-09-25-pm


Any two rectangles are similar because even though all of the angles on a rectangle are 90 degrees. A rectangle isn’t a rectangle if all of its angles are not 90 degrees therefore proving that all rectangles are similar. There also will be a scale factor because


Any two equilateral triangles are similar because in order for an equilateral triangle to be an equilateral triangle all of the angles have to be 120 degrees which is 360 divided by 3. If all of the angles are congruent in an equilateral triangle, that means that any equilateral triangle is similar!


Good and Bad Notes in My Math Notebook

img_1396

This is an example of my best notes. I chose this because when I read it, I can comprehend the information very easily. I also wrote out the number sentences and color coded.
img_1397

This is an example of my bad notes. I chose this because I think that it is messy. I think that when using a highlighter you should be color coding and clearly I didn’t do that. I also overused the highlighter and I just don’t like this page as much as other pages.

Math Check In #2

img_0372 img_0373

To complete the first side of this handout I had to figure out which shapes were mathematically similar. Earlier that day in math class we learned about what to look for when trying to figure out if two shapes are similar. You have to see if the corresponding angles are congruent and you have to see if the two shapes are related by a scale factor. What I did first was I measured the side lengths of each shape to see if I could make any comparisons. I also looked at the general shape of each figure to see if I could make any guesses about which shapes were similar. After I found which shapes were similar, I wrote the scale factor and explained my work and thoughts!

For the second side I did each question individually as if it were its own problem. For the first problem I knew that if a figure was congruent, it would be identical to the original one. To keep the figure similar the corresponding angles had to be congruent which was quite simple because it is a rectangle. The two figures also had to be related by a scale factor. I made the scale factor 2 and .5 which gave me 8×6! For the next problem I drew a 5×5 rectangle which is in no possible way similar to the original rectangle. For the next problem I did the same thing that I did for the first one. For the last one I made a right triangle which makes not all of the corresponding angles congruent.

My Math Profile

Dear Michelle,


I don’t remember a lot about myself as a student in math before a few years ago. All I know is that in third grade, I loved math. In math class, we started learning about multiplication and we had to study our flashcards every day. I always went to my dad when I had trouble or if I needed to talk about math in general. I had a few flashcards I was stuck on and my dad would always make silly phrases so that it would stick in my head. For example, seven times seven equals funky 49 and 8 times 8 equals crazy 64. Ever since then, I started excelling in the multiplication assessments. Another time that I was really excited about math is when I started having a tutor to help me prepare for the ISEE exam. When I started to learn things that we haven’t learned in class yet, my grades were higher and I got into math seminar! (Finally!) I was so excited to be a part of an advanced math group that I couldn’t stop talking about it! To this day I still love multiplication and I always remember the little tunes that my dad made up to help me.


Something I like about learning math is when I have a moment where everything clicks. It is almost as if everything I have been trying to understand makes complete sense and I feel confident in what I’m doing. Something I don’t like about math is that it can be really stressful after school and during a test. I have always had an extremely busy schedule and terrible time management so I always end up stressing myself out by doing things last minute. This year I hope that will end because I have made a system to manage my time! When I am doing homework sometimes I listen to music to drown out other noises. It helps me when I am stuck on something because once it clicks, I work to the beat of the song. Despite what my parents think, music always helps me focus on what I’m doing and blocks out distractions around me. Music has been a huge part of my life because I am a dancer and a musician. The only time I don’t put in earbuds is when I’m studying, when I have a big project, or if I don’t think that the music will help me focus on the assignment.


The last thing I want to mention in my profile is that I haven’t always considered myself a good math student. When I was younger, I always asked for more explanation or help. I thought that since I needed help, I wasn’t good at math. Even though I didn’t realize it at the time, having that extra help made me a better math student. Before I knew it, in 4th grade I came early to school and went to the tech lab for an advanced math class with Debra along with some other kids in my grade. The past few years I have been working hard in math and trying to be the best mathematician that I can be. I hope that this year I will do well in math and I look forward to getting to know you!


Sincerely,

Olivia B.

Before and After!

IMG_1634This is my math notebook at the beginning of the year.

IMG_1635This is my math notebook now.

In the beginning of the year, my problems were very squished together and I couldn’t tell which problem was which. Now I have made the problems more spread out and put more boxes in between each problem. I think it’s important to have my notebook this organized because if I need to come back to a problem or strategy I can find the exact one I need.

Population Graph!

Screen Shot 2014-10-18 at 3.50.51 PMThis is a picture of my population graph. The axis represent time and the population of the world. We had to start the time axis from 100,000 B.C.E. (before common era.) What number we were going to skip count by (I did every 5,000 years) was up to us. Today the population is a little over 7 billion people. What really changed my data points was when Ana said that 5,000 B.C.E. there were only 5 million people. It changed my data points because I thought that the population wouldn’t even be that low. The population was not that high until the mid 1800s when we hit our first billion. That changed my graph a lot.

20 Meter Graphs!

ADH5-graphsIn Math class Ana told us to make graphs for a race that will be 20 meters. We could do it any time but it had to represent 20 meters. I thought that one of the graphs in story b were inaccurate because they started out at 5 meters and one of them stopped for 4 seconds. The one that is red that is put in a doesn’t make sense because it goes straight the whole time. Lastly in C, most of them are accurate except for the bottom left graph because it goes straight up in 5 seconds even though you are slowing down as you get to the finish line.