These are some division and multiplication problems that we did during class. I am proud of them because I normally get stuck on division problems but after Ana showed us a new strategy to solve the problem I could figure it out with out being stuck. You will be able to see the way I solved these problems in the picture.

Category Archives: Chaney
My Polygon Venn Diagram
This is my polygon venn diagram. It has all different categories of where the shapes will go. Also most of the circles go into circles, that means they go into that category but they also go into a different category. The reason why the triangle doesn’t go into the quadrilateral is because a triangle doesn’t have four sides and a triangle angle sum is 180 and all quadrilaterals is 360.

My Tessellations
This is my GSP tessellation. A tessellation is a shape that can repeat over and over again and it will never stop going until you decide to stop. Most of the time if you have more than 4 or 4 shapes put together they make a shape from all the sides put together. My tessellation has squares, rhombuses and triangles. I made all of these shapes in GSP. GSP stands for Geometers Sketchpad.

Math Puzzles
This is my puzzle. It is probably about a level 1 or 2
My number is even.
My number can make a square array.
My number is a multiple of 52.
My number is a factor of 100.
Population of the World Graph
In math class we all had to make graphs based on the population of the world. My graph looks like this because first the population goes up. Then it drops down because of wars  and people from sicknesses. Then it goes up because people are sort of getting better ways to help fix the problems that were not fixed before. Again the population drops a little bit, not as much as before. It drops because some thinks crash and fall on people like buildings or people get into accidents. Soon it keeps on going up because people can think well and can solve almost all of the problems that were problems before. Some problems I had was I did not know what numbers I should have put on the bottom. I was surprised that there weren’t as many people as I thought there would be in the world. At first I had my graph looking differently but after Anna said something I changed it. I am still a bit confused so my graph might not look 100% accurate.
Mix and Match Graphing Activity
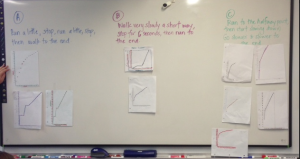
 In math class today we made graphs to match with one of the problems we could choose and then we would give it to Anna. Anna would give the problem to somebody else in the class and they would have to guess which problem the graph went with. I think the third problem(c) is the hardest because you first run until you get to 10 meters then you start slowing down for the next 10 meters. before I thought problem A or B would be the hardest because you have to stop and then run again, but when we were looking at other peoples graphs I noticed it was easier. It may not have been easier but I think it might be even though I did not try it yet. I wonder how it would be if you actually did all of these kinds of runs in real life?