In math we are using recap. Recap is an app that allows us to explain things to Michelle. I have found this very helpful in math. I think in doing this I could work a little harder on it so that I show my best possible work.
Category: Math
(Untitled)
Figures are mathematically similar…
Two or more figures are similar when they share a scale factor, their corresponding angles are congruent, and they have a true proportion. They also have to have the same general shape so a triangle and a rectangle can’t be similar.
To find a scale factor you have to take two corresponding sides and divide the bigger one by the smaller one. The answer is the scale factor. To find a true proportion you have to take two side lengths from the two or more shapes that correspond to each other and make their measurements into a ratio. Then your cross multiply them and if they each equal the same thing they are similar. Finally to find the if the corresponding angles are congruent you find the corresponding angles and measure them with a protractor.
True or false…
Any two rectangles are similar?
False because their side lengths could possibly not share a true proportion which means they are not always similar. In order for them to be similar their side lengths need to share a true proportion. Also if this is true then that means they do not share a scale factor.
Any two equilateral triangles are similar?
True because in order to be an equilateral triangle you have to have the same length of all of your sides. That means that there is a true proportion and a scale factor. That also means that the corresponding angles are congruent.
Math Notebook
Checkup #2
This year in math we are working on stretching and shrinking. A major part of this is scale factor. Scale factor is the size difference between two shapes. This is a very important part of stretching and shrinking. Lets say one shape has a perimeter of three and you add a scale factor of three, the new shape will have a perimeter of nine.
Math Profile
Math in the past for me has had its ups and downs. In fifth grade I loved math. It was my favorite subject. As I got into six grade I started to struggle a lot which made it more stressful and dislike full. What I like about learning about math is that I can be really rewarding at times when you accomplish something. What I dislike about math is that you can get really stressed out with it at times when you don’t get something right. I consider myself a good math student because I don’t quit when I get stressed out. One of my flaws in math is studying and that is a really good goal for me in the future. I need to learn how to study and what to study. Another goal for me is to check over my work, last year on test I would just do the test and not check my work and many times my work was wrong and I got a bad grade so I learned that I need to go back and check my work when I think i’m done.
6th grade math
6th Grade Math
6th Grade Math
Before and After of Math notebook
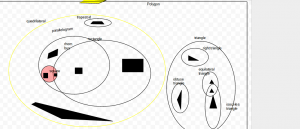
Polygon Venn Diagram
 This is my polygon Venn diagram. A Venn diagram is two or more circles that connect in different ways. If they overlap it means that there are three categories. Sometimes it can be one circle inside of another or the circles could not even connect. What we had to do is sort certain polygons in their category.


